Modelling and Monitoring
- Dec 14, 2022
- 5 min read
Updated: Sep 9, 2024
humblebee hive – retrofit #8

Haha, despite the picture above, not that kind of modelling…
Give me some numbers! Having given you lots of story, I thought it was time I gave you some performance figures, both calculated and measured…
Some might say I’m not a typical engineer, if such a person exists. Sure, I like to solve problems, fix issues – it’s hard for me to stop myself, even when dealing with people, especially family. But at the end of the day, data is not what makes me tick. Comfort, positive outcomes, quality of life, balance, energy, “doing the right thing” (within my value framework) – those are my drivers. Besides, climate is variable year on year, and we all experience temperature differently so the results of what I do are largely subjective. I write this feeling (only slightly) cold in my parent’s and sister’s house in the south of Spain, even though the thermometer says it’s still 26 oC, but outside the sun is rising, the windows are open and it’s the coolest it’s been in three weeks at just above 21 oC. Note: I started this post in August… and ironically today is the coldest day ever at -7 oC!
Having said that, sometimes it’s useful to quantify the problem, and it’s satisfying to see tangible results. After a number of years – decades even – you get a feel for what’s worthwhile, pragmatic, effective. But I know the numbers are important validation of the theory, so there’s value in laying it all out.
How much are we really saving and how close is reality to the theory?
We moved into our house and started collecting monthly meter data. I was diligent enough in my first year, with pretty regular readings. As work picked up, I became less focused on the existing performance, and more so on the modelling. I use the Passivhaus Planning package (PHPP) for most of my day-to-day work because it gives some pretty impressive “predictions” considering it’s not black box dynamic simulation software and it’s sensitive to small changes in specification. So it was natural for me to model our very simple house in as much detail as possible.
As part of my Retrofit Assessment training with the Carbon Coop / People Powered Retrofit scheme, I also modelled my own home using their tool, the Home Retrofit Planner, which gave its own useful insights. It uses an enhanced RdSAP methodology and shares some of the PHPP diligence, though doesn’t go quite as far.
So between November 2018 and October 2019, our household consumption (gas central heating, no controls apart from boiler heating schedule and gas hob cooking) was as follows, for yearly totals of 21,985kWh (g) and 2,813 kWh (e):
We set up humblebee in September 2018 and I so was already working from home, while M was full time at the office, and the children were in full time school, so our usage profiles were probably quite typical, perhaps with a bit more daytime activity than the average household.

Annual Energy Consumption: actual pre-September 2022, the rest is prediction…
Bearing in mind pandemic lockdowns and the fact that M is now also mainly WFH, we expected consumption to be higher pre-works, but various behaviour nudges allowed us to save on gas year on year, climate variations notwithstanding. In the predicted consumption for the coming year, I’ve allowed for a higher electricity bill because of our switch to an electric hob and the MVHR.
Modelling the Dwelling

Image credit: People Powered Retrofit, Home Retrofit Planner tool
The Home Retrofit Planner predicts a drop of 66% drop in peak heat load and a 60% in yearly heating demand after this significant Phase 1 stage, while a full EnerPHit will get us to a 75-80% reduction from the starting point, which was an uninsulated, but average double glazed, 70’s detached house with an ageing gas central heating system. It’s too early to give complete consumption data post works but comparing November consumption this year (2022) and in the Novembers of 2018/2019, which were similar, we seem to have already dropped gas use by 70-75%, even allowing for the hob switch and bearing in mind we’re both working from home.
The simulations assume an indoor temperature of 20-21oC. We lived through most of the spring with internal temperatures down to 17oC, surprisingly – have I ever told you how “nesh” I am? With the evenness of surface temps and draught reduction it means we experience it differently, and so we can’t imagine needing more than a couple of electric heaters once the floor is insulated and made airtight, and after we’ve sorted the loft airtightness line.

Kitchen data logger, period covered: 2/2/22 – 29/7/22

Main Bedroom (South-West facing) data logger, period covered: 2/2/22 – 29/7/22
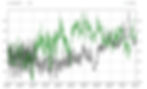
First Floor Study (North-East facing) data logger, period covered: 2/2/22 – 29/7/22
And above is how temperature and humidity varied in 3 of the 5 monitored rooms since the spring. Spot the heatwave…? Unfortunately the living room data logger stopped logging after it lost battery charge, so only the kitchen was giving downstairs recordings over the summer, albeit with more fluctuation than your average room. Heating was switched off at the beginning of April and remained off – except for maybe a couple of boosts during longer cold spells – until the winter.
The MVHR system was commissioned on 3rd May, the airtightness test was carrried out on 5th May, and External Wall Insulation was completed by the 9th May. We’re still experiencing high infiltration through the ventilated floor and now that everything else is super-insulated, it’s very noticeable!
Solar is online!!

A sunny day! Our best usage rate (in consumption terms) to date…

Panels doing a hair curler impression with ice sheets – beware of falling ice blocks!
The solar PV panels – which have been operational since 17th November when the inverter arrived, at a predicted generation of 5370kWh/a – should cover more than our current annual electrical consumption in net terms (not necessarily as self-consumption, which we think will cover about 60%). But as we’re with one of the few truly renewable suppliers – Good Energy are only one of 3 that provide “additionality” to the grid – from a carbon accounting perspective, this all counts.
In money terms, who could have predicted the energy cost hikes of the last 18 months? But we will be £805* better off on electricity and over £1,000* on gas after a whole year if estimations are correct. And in carbon terms we will be avoiding 2.5T CO2 (equiv.) per year.
The Elitech data loggers – kindly on loan from Richard Shears (Retrofit Hub) – will allow us to determine an overall Heat Loss Factor pre- and post-works, so once I have that information, and a whole year’s worth of consumption figures, I’ll be sure to update you with another blog entry, including how we’re faring right now with the sub-zero temperatures.
The current plan is still not to go for a heat pump after the floor refurbishment, but have direct electric radiators, immersion heating for our hot water, with a PV diverter to use up as much on site generated electricity as possible. I’ll let you know if we change our minds…
Stay warm!
*based on 2022-2023 (current) charges, but not including selling excess back to the grid
